Education
Schools in statistics
An overview of the key statistics on schools, teachers and pupils in Northern Ireland’s complex education system.
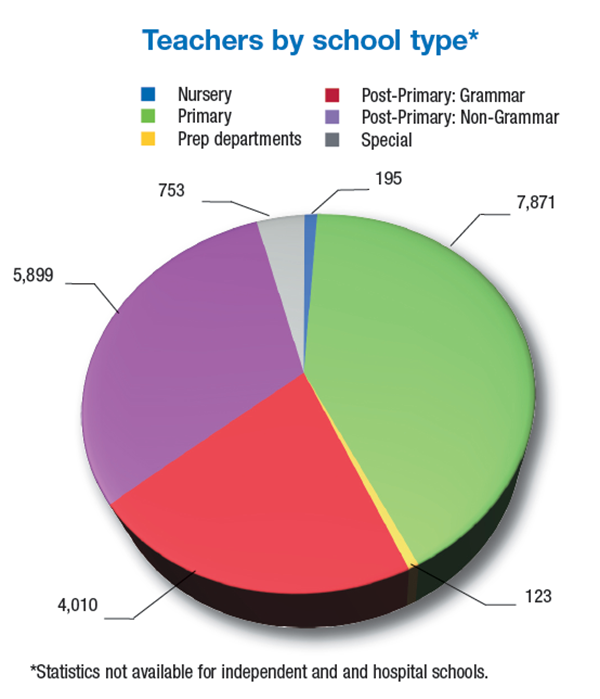
Pupil-teacher ratios (2011-2012)
| 25.4 | Nursery |
| 20.5 | Primary |
| 16.3 | Prep departments |
| 15.6 | Post-primary: grammar |
| 14.3 | Post-primary: non-grammar |
| 6.0 | Special |
All figures for 2011-2012 unless otherwise stated.
School types
| Total number of schools | 1,210 |
| Nursery schools | 97 |
| Controlled | 65 |
| Catholic maintained | 32 |
| Primary schools | 839 |
| Catholic maintained | 392 |
| Controlled | 378 |
| Irish medium | 23 |
| Grant maintained integrated | 23 |
| Controlled integrated | 19 |
| Other maintained | 4 |
| Post-primary (non-grammar) schools |
148 |
| Catholic maintained | 71 |
| Controlled | 56 |
| Grant maintained integrated | 15 |
| Controlled integrated | 5 |
| Irish medium | 1 |
| Grammar schools | 68 |
| Catholic voluntary | 29 |
| Non-Catholic voluntary | 22 |
| Controlled | 17 |
| Special schools | 41 |
| Independent schools* | 15 |
| Hospital schools | 2 |
*13 schools offering both primary and post-primary education and two primary schools
Pupils and sectors by background in 2011-2012 (%)
| Level | Sector | Protestant | Catholic | Other |
| Primary | Controlled | 72.3 | 5.4 | 22.3 |
| Maintained | 1.0 | 96.9 | 2.1 | |
| Integrated | 45.6 | 27.1 | 27.4 | |
| Post-primary (non-grammar) |
Controlled | 82.4 | 2.1 | 15.4 |
| Maintained | 0.8 | 98.1 | 1.1 | |
| Integrated | 47.9 | 36.2 | 15.9 | |
| Post-primary (grammar) |
Controlled | 76.8 | 7.7 | 15.4 |
| Maintained | 0.9 | 97.9 | 1.2 | |
| Integrated | 67.1 | 11.1 | 21.8 |
Deprived areas: education score
| Most deprived | Least deprived | |
| 1 | Shankill | Malone |
| 2 | Crumlin | Stranmillis |
| 3 | Woodvale | Cultra |
| 4 | Falls | Stormont |
| 5 | Dunanney (Newtownabbey) | Galwally (Castlereagh) |
| 6 | Ballymacarrett | Cairnshill (Castlereagh) |
| 7 | The Mount (East Belfast) | Hillfoot (Castlereagh) |
| 8 | Whiterock | Drumbo |
| 9 | Duncairn | Craigavad (North Down) |
| 10 | Shaftesbury | Knockbracken |
Source: Northern Ireland Multiple Deprivation Measure 2010.
A-level
| % | 2007 | 2008 | 2009 | 2010 | 2011 | 2012 |
| A* | – | – | – | 9.3 | 8.6 | 7.7 |
| A*-A | 33.2 | 35.4 | 34.5 | 35.7 | 34.5 | 31.9 |
| A*-C | 83.8 | 84.4 | 84.6 | 84.5 | 84.2 | 83.5 |
| A*-E | 98.0 | 98.2 | 98.4 | 98.1 | 98.1 | 98.1 |
| Entries (no.) | 30,815 | 30,020 | 31,374 | 31,741 | 32,582 | 32,908 |
AS-level
| % | 2007 | 2008 | 2009 | 2010 | 2011 | 2012 |
| A | 32.8 | 33.1 | 34.3 | 33.9 | 31.6 | 29.5 |
| A-C | 77.2 | 77.4 | 78.2 | 77.6 | 76.5 | 76.1 |
| A-E | 95.1 | 95.2 | 95.0 | 94.4 | 94.3 | 94.6 |
| Entries (no.) | 38,886 | 37,017 | 42,095 | 41,921 | 42,666 | 44,468 |
GCSE
| % | 2007 | 2008 | 2009 | 2010 | 2011 | 2012 |
| A* | 8.2 | 8.9 | 9.1 | 8.9 | 8.5 | 8.9 |
| A*-A | 24.8 | 26.4 | 27.1 | 27.5 | 27.7 | 27.9 |
| A*-C | 72.4 | 74.5 | 75.1 | 76.3 | 74.8 | 75.6 |
| A*-E | 98.0 | 98.4 | 98.6 | 98.7 | 98.7 | 99.0 |
| Entries (no.) | 197,485 | 192,360 | 184,748 | 183,899 | 178,017 | 171,354 |


