Health inequalities 2021

Life expectancy continues to increase in Northern Ireland but there are worrying signs of widening inequality gaps, especially in relation to drug-related deaths.
Life expectancy
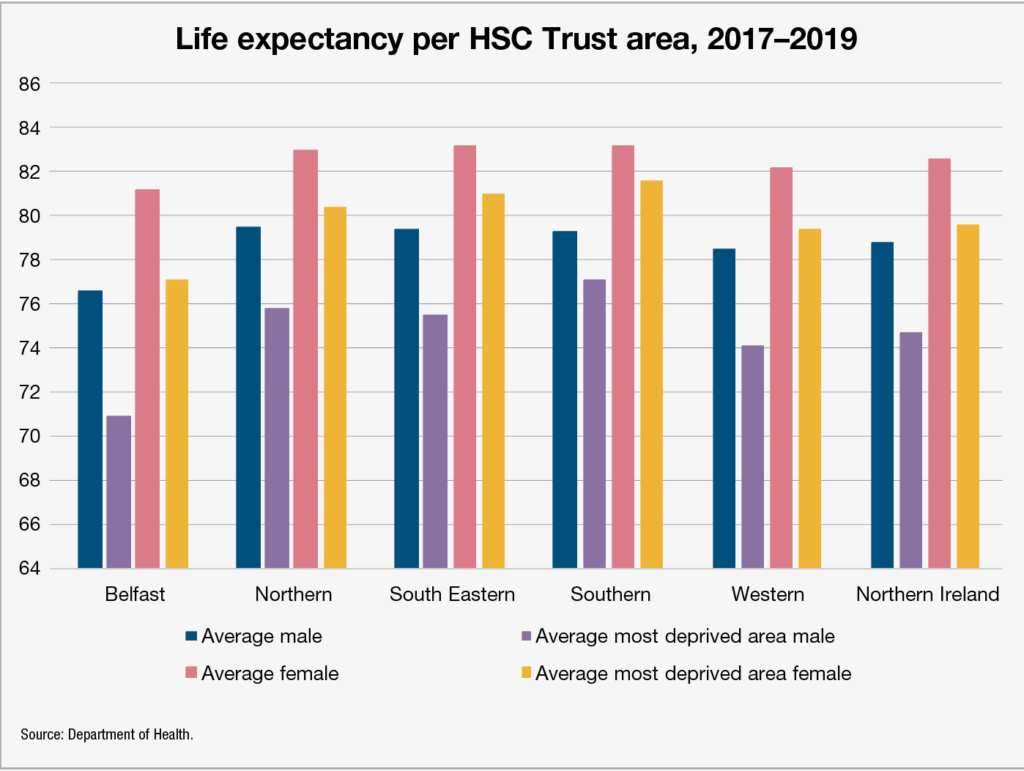
The Health Inequalities Annual Report 2021 states that between 2017 and 2018, male life expectancy at birth has continued to improve in both the most and least deprived areas of Northern Ireland. However, the deprivation gap among males in terms of life expectancy stands at 7 years, a slight improvement on the 7.1 years reported in 2020. Female life expectancy improved overall but the deprivation gap has slightly widened since the 2020 report, from 4.4 years to 4.8 in 2021.
Both the male and female life expectancy deprivation gaps are now wider than they had been from 2013-2015, when the male gap was 6.5 years, and the female equivalent was 4.5 years. Overall life expectancy for males now stands at 78.8 years, and 82.6 years for females; male life expectancy at 65 is now a further 18.5 years overall, with a three-year deprivation gap, and female life expectancy at 65 is a further 20.8 years overall, with a deprivation gap of 2.5 years. Both of these overall figures show improvement from 2013-2015, as does the male deprivation gap, although the female gap has slightly widened.
Worryingly, three of the health and social care trusts show a widening of the male life expectancy gap in their areas. All five trusts report no change in the female inequality gap.
Belfast Trust’s area, where the male life expectancy of 76.6 years is 2.2 years less than the overall average, reports an unmoving inequality gap of 5.7 years. Female life expectancy stands at 81.2 years, 1.4 years less than the overall average, and an inequality gap of 4.2 years is reported. Overall life expectancy for males in the area covered by the Northern Trust is 79.5 years, 0.7 higher than the overall average. However, the male inequality gap has widened to 3.7 years, meaning the males in the most deprived area of the ward have a life expectancy of 75.8 years. Female life expectancy in the ward stands at 82.9 years overall, again 0.7 higher than the overall average, with an unmoving inequality gap of 2.5 years.
The South Eastern Trust again shows a widening male life expectancy gap. Its overall male average of 79.4 years ranks it 0.6 years ahead of the overall average, but its inequality gap has widened to 3.9 years. The area’s female life expectancy is 83.1 years, 0.5 above the Northern Ireland average and with an inequality gap of 2.1 years. In the Southern Trust area, an overall male life expectancy of 79.3 years is reported, with a narrowing inequality gap of 2.2 years. Female life expectancy also stands at 83.1 years here, with no change in an inequality gap of 1.5 years. The Western Trust area reports a male life expectancy of 78.5 years, 0.3 lower than the average, with a widening inequality gap of 4.4 years. Female life expectancy stands at 82.2 years, with an unmoving inequality gap of 2.8 years.
No major changes have been reported in either male or female healthy life expectancy or disability-free life expectancy for males or females. The average male healthy life expectancy stands at 59.2 years, a slight decrease from the 59.7 recorded from 2016–2018, with an inequality gap of 13.5 years, its lowest since the 11.9 year gap recorded from 2013–2015. The overall average healthy life expectancy for females stands at 61 years, an increase of 0.2 years on 2016–2018. Despite the inequality gap of 15.4 years being a slight raise of 0.2 years, it is still at its highest rate since 2013.
Male disability-free life expectancy stands at 57.9 years, its highest since 2013, and its inequality gap has fallen from 14.5 years in 2016–2018 to 12.5 years. Female disability-free life expectancy stands at 58.4 years, a 1.2-year rise on 2016–2018 levels, with an inequality gap of 13.3 years, a slight decrease from the 13.9 gap of 2016–2018 but still ahead of the 2014–2016 gap of 11.3 years.
Premature mortality
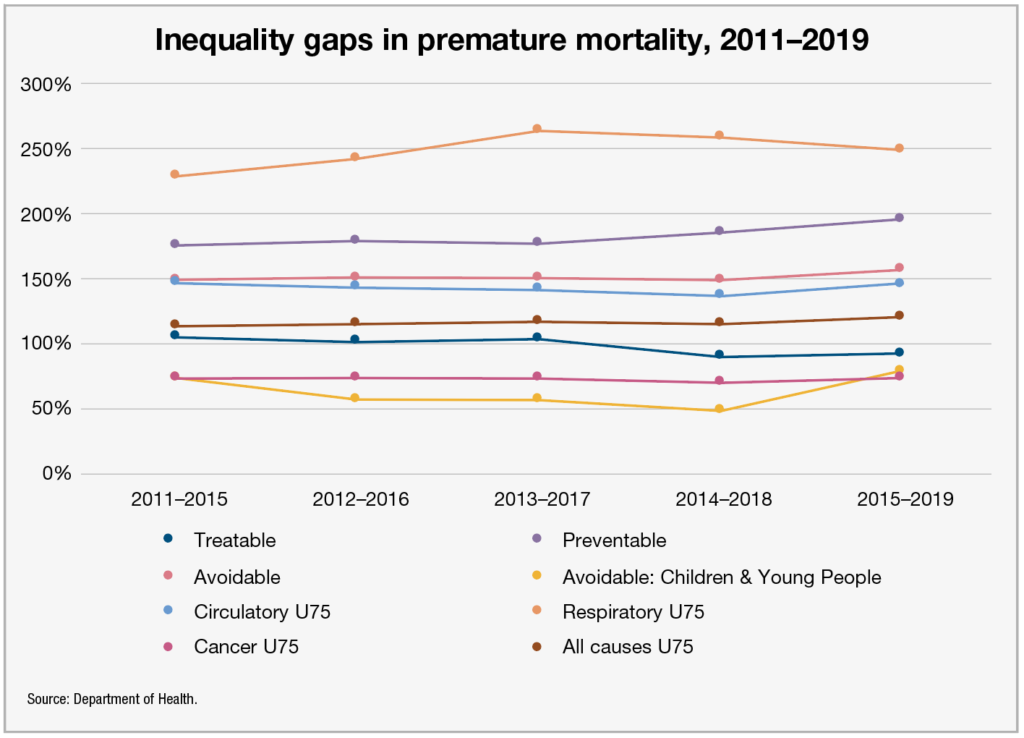
Rates of premature mortality generally decreased in Northern Ireland over the 2017–2019 period, but large inequality gaps persist between the least and most deprived areas. For example, respiratory mortality among under 75s in the most deprived areas is three and a half times that of those in the least deprived areas.
The rate of potential years of life lost per 100 people fell from 8.6 years in 2016–2018 to 8.5 in 2017–2019. However, the rate in the most deprived areas slightly rose from 13 years to 13.2 years in the same time, while the rate in the least deprived areas remained stagnant at 5.7 years. The inequality gap in this indicator now stands at 130 per cent, significantly higher than the 118 per cent gap of 2014–2016.
Using the OECD definitions of avoidable mortality, the standardised death rate (SDR) from treatable causes stands at 84 per 100,000 of population. This figure rises to 120 in the most deprived areas and falls to 62 in the least deprived areas, a 92 per cent inequality gap for the 2015-2019 period, a slight raise on the 90 per cent raise of 2014–2018, but still an improvement on the 104 per cent rate of 2011–2015. The SDR in the most deprived areas has fallen in raw numbers in this same period from 133 per 100,000 to 120.
The SDR for deaths considered preventable show a worrying widening of the inequality gap from 175 per cent in 2011–2015 and 184 per cent in 2014–2018 to 195 per cent in 2015–2019, meaning that people in the most deprived areas are now almost three times as likely to die from preventable causes as those in the least deprived areas. The overall SDR for preventable deaths is 170 per 100,000, 297 in the most deprived areas and 101 in the least deprived areas.
SDR in avoidable deaths also shows a widening inequality gap despite long-term improvements in both the least and most deprived areas. 417 avoidable deaths per 100,000 in the most deprived areas shows improvement from the 429 in 2011–2015, but a decrease from 173 per 100,000 to 163 in the same times in the least deprived areas means that the inequality gap now stands at 156 per cent, a widening from 2011–2015’s 148 per cent.
Among the most worrying of the stats in the entire report is the significant widening of the inequality gap in the SDR for avoidable deaths of children and young people. Having stood at 72 per cent in 2011–2015, the gap had closed to 48 per cent by 2014–2018, but now stands at 77 per cent. With an overall rate of 23 deaths per 100,000, this figure rises to 30 in the most deprived areas and 17 in the least deprived areas. Despite the widening inequality gap, in raw numbers terms, all of the categories show improvement from 2011–2015, when an overall rate of 24 per 100,000 was flanked by rates of 34 and 20 in the most deprived and least deprived areas respectively.
SDR across all causes (respiratory, circulatory, and cancer) in under 75s all sow either stagnation or improvement in raw numbers in all categories except respiratory, where both overall deaths per 100,000 and deaths in the most deprived areas have increased since 2011–2015. Inequality gap in circulatory and cancer SDRs have narrowed slightly and stayed the same respectively, while the gaps in respiratory and all causes have widened.
Suicide, alcohol, and drug-related deaths
Some of the greatest inequalities in Northern Ireland’s health indicators remain in the crude death rate for intentional self-harm and alcohol and drug-related indicators. The crude death rate from intentional self-harm does, however, show signs of improvement in both raw numbers and in the narrowing of its inequality gap.
Only the crude death rate per 100,000 of population in the least deprived areas shows an increase, from 6.9 in 2013–2015 to 7 in 2017–2019. An overall crude death rate of 9.7 per 100,000 shows a decrease from 11.6 in the same time period, with the rate in the least deprived areas dropping from 17.9 to 14.3. The inequality gap has noticeably narrowed, from 161 per cent to 105 per cent, although this does still mean that death via suicide is over two times as likely in the most deprived areas as compared to the least deprived.
The SDRs for both drug- and alcohol-related deaths have worryingly increased across all markers. Alcohol-specific deaths have an overall SDR of 17.1 per 100,000 for the period 2015–2019, an increase on the rate of 14 of the 2011–2015 period. Both the least deprived areas (from 6.6 per 100,000 to 8.3) and the most deprived areas (29.8 per 100,000 to 34.9) suffered increases in this same time period, where the inequality gap shortened from 348 per cent to 319 per cent.
The SDR for drug-related causes also shows and increase in all three categories, with an overall rate of 8.5 per 10,000 for 2015–2019, an increase from 2011–2015’s 6.3. Both the least deprived (3.0 per 100,000 to 4.0) and most deprived areas (13.5 to 20.3) also suffered increases, with the inequality gap widening from 347 per cent to 404 per cent.

