Census 2011: a snapshot of society
 Northern Ireland has welcomed thousands of migrants and is home to a larger, more educated workforce, according to the latest census figures. Family structures, though, are weaker and political identity is becoming harder to measure. Peter Cheney reviews the trends.
The most detailed profile of how the people of Northern Ireland live today has been published in ‘Key Statistics for Northern Ireland’, the third release of information from the 2011 census.
The statistics reveal the state of its living standards, level of education, working patterns, and political-religious identity.
The overall total population was published in June and was followed by a breakdown by age, sex and geography in September (agendaNi issue 55, pages 14-15). The trends outlined over the following pages show that Northern Ireland’s population is becoming more educated, with a larger workforce, and also views itself as healthier than before. That said, the number of people living with chronic conditions or disabilities has increased and higher unemployment is holding the economy back.
Society is increasingly secular but most people still have some link to a church. Marriage is less common as more couples live outside wedlock, relationship breakdown increases and more parents (mainly mothers) bring up children alone.
Northern Ireland no longer has a Protestant majority but the proportion of Catholics only increased slightly: both communities are therefore minorities with a growing group of ‘other and none’ making up the statistical gap.
The province’s ethnic minorities are larger than before but still relatively small (0.8 per cent) when compared with other parts of the UK. Fourteen per cent of England and Wales’ population is non-white.
“It’s worked pretty well this time round,” Dr Ian Shuttleworth, a demographer at Queen’s University Belfast, said of the process. Shuttleworth points out that Northern Ireland is sharing in some of the major trends occurring across the UK and Ireland i.e. an ageing population and growing immigrant communities.
Surprises for him included “the complexity of the religion question” and the emergence of a Northern Irish national identity. Commentators have been unable to conclude whether the ‘Northern Irish’ results represent a single group or two different groups (one more British and one more Irish) using the same label.
Information on specific countries of birth, smaller religious denominations and non-Christian religions will be released in February. More detailed tables comparing more than one variable (e.g. age and health) will be published in March or April.
The most sensitive questions in the census cover a person’s relationships and health. Living arrangements were recorded for the 1,409,368 people aged over 16.
Within that group, the percentage of married people decreased by 3.5 per cent while those classed as single (including co-habiting couples) increased by 3 per cent. While 7.9 per cent were either divorced or separated in 2001, that figure had increased to 9.5 per cent in 2011.
Single parents with dependent children increased from 50,641 in 2001 to 63,921 in 2011. Of these, 58,282 were single mothers and 5,639 were single fathers.
Same-sex civil partnerships changed the legal terminology when they were introduced in 2005. At the census, 680,831 people were married and 1,243 were living in civil partnerships. Civil partners have the same legal rights as married persons and the Executive has no plans to introduce same-sex marriage.
| Living arrangements | % | |
| 2001 | 2011 | |
| Married | 51.1 | 47.6 |
| In a civil partnership | 0.0 | 0.09 |
| Single (never married or in a civil partnership) | 33.1 | 36.1 |
| Legally separated | 3.8 | 4.0 |
| Divorced (or civil partnership dissolved) | 4.1 | 5.5 |
| Widowed (or civil partner deceased) | 7.8 | 6.8 |
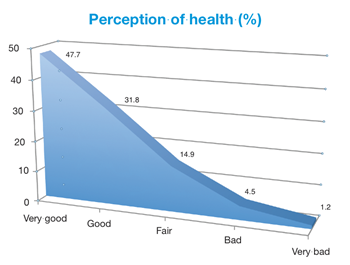
Four out five of people (79.5 per cent) described themselves as being in good, or very good, health but one in five (20.7 per cent) were living with a long-term health condition or a disability. In the 2001 census, 70 per cent had said that their health was good.
374,646 people experienced a long-term health condition or disability, an increase from 343,107 people ten years ago. Among those conditions, mobility or dexterity problems were most common (affecting 207,173 people), followed by long-term pain or discomfort (182,820) and shortness of breath or breathing difficulties (157,890).
Emotional, psychological and mental health conditions affected 105,528 people. 93,091 people were living with some form of hearing loss and 30,862 experienced blindness or partial sight loss. The census also recorded 122,301 unpaid carers (11.8 per cent of the population), of whom 56,310 provided care for 50 or more hours each week.
The size of the main communities in Northern Ireland is traditionally measured by asking a person’s religion. This is the only optional question in the census form, thus allowing people with no religion to abstain.
In 2001, a second question was added to cover the religion in which he or she was brought up i.e. their community background. In both cases, Protestants regularly account for the vast majority of the ‘Protestant and other Christian’ category.
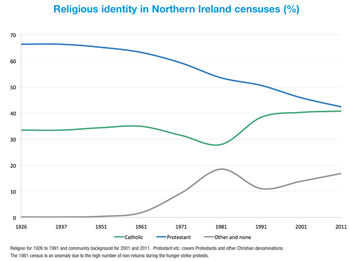 The percentage of professing Catholics increased slightly from 40.3 per cent to 40.8 per cent while percentage from Protestant or other Christian denominations declined from 45.6 per cent to 41.6 per cent. Each of three main Protestant churches experienced declines: down 8,967 in the Church of Ireland, 4,920 in the Methodist Church and 3,641 in the Presbyterian Church. The smaller denominations saw a collective increase of 2,159.
Northern Ireland is, undoubtedly, a more secular society than at the turn of the millennium but still has a more religious culture than Britain. 82.4 per cent of the province’s population professed some form of Christianity, compared to 59.3 per cent in England and Wales.
The share of those stating ‘no religion’ or not answering the religious question increased from 13.9 per cent to 16.9 per cent. Followers of non-Christian religions almost tripled but they are still a small minority (0.8 per cent).
The community background answers also show a narrowing between Catholic and Protestant and confirm that both communities are now minorities. 48.4 per cent identified themselves as Protestant and other Christian and 45.1 per cent as Catholic. In 2001, the figures were 53.1 per cent and 43.8 per cent respectively.
The Protestant and other Christian community background group decreased in size by 19,660 while those from a Catholic background increased by 79,973; the latter trend is partly due to migration from Poland and Lithuania.
In the Republic’s 2011 census, 84.2 per cent of population was Catholic, 7.6 per cent had no religion, 6.3 per cent were Protestant and other Christian and 1.9 per cent followed non-Christian religions.
The number of people who were not brought up with any religious belief more than doubled over the decade and now makes up 5.6 per cent of the population. This significant increase will make the traditional Protestant-Catholic divide harder to interpret in future censuses.
In a new addition for the 2011 census, people were asked for asked for their preferred national identity. 39.9 per cent were British only and 25.3 per cent Irish only. Significantly, one in five people (20.9 per cent) identified themselves as Northern Irish only. In England and Wales, a much lower percentage (19.1 per cent) identified themselves as British only.
Five per cent (90,572) chose other national identities: a group which includes recent immigrants and locally-born people from ethnic minorities with an attachment to their home countries.
Growing ethnic diversity
 Northern Ireland’s population was mainly white (98.2 per cent) and largely born in the province (88.8 per cent) but was more ethnically diverse than it was in 2001. The number of people born in Great Britain or the Republic of Ireland was virtually unchanged, at 120,557.
In 2001, a total of 10,355 people hailed from other EU countries, mainly in Western Europe. Ten years later, this group comprised 9,703 people but was outnumbered by those from the new EU accession states.
35,704 residents (1.8 per cent) were from countries which joined the EU from 2004 onwards. This is an exponential increase from 710 Eastern Europeans in 2001 and the new community is now an established part of our society. Another 36,046 people were born elsewhere, up from 20,204 in the last census.
The Chinese community increased in size from 4,145 to 6,303 people. It is nearly matched by the Indian community, which saw a major increase from 1,567 persons to 6,198. A total of 6,014 people came from a mixed race background, up from 3,319.
Information on the main language spoken was collected for people aged three and over. Of these, 96.9 per cent stated English and 3.1 per cent others. Polish was the largest foreign language spoken (17,731 speakers), followed by Lithuanian (6,250 speakers). Chinese was regularly spoken by 2,214 people.
184,898 people had some knowledge of the Irish language and 4,164 people considered it their mother tongue. Knowledge of Irish only increased slightly from 10.3 per cent in 2001 to 10.7 per cent in 2011. Census respondents were asked for their experience of Ulster-Scots for the first time. A relatively large number of people (140,204) had some knowledge but this group was concentrated in North Antrim and Ards.
Housing, study and work
A doubling in the number of private rented properties represented the strongest trend in housing. Private landlords owned 95,215 households, up from 41,676 households in 2001: an increase from 6.6 per cent to 13.5 per cent.
The total number of households increased from 626,718 to 703,275, up 12.2 per cent. Of these, 470,507 were owner-occupied; the percentage of those households decreased from 68.8 per cent to 66.9 per cent.
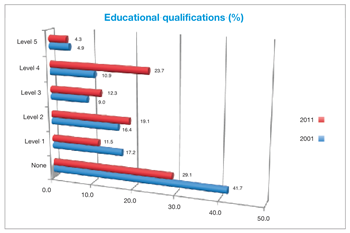
At a regional level, 22.7 per cent of households did not own a car or van. This rises to 31.5 per cent in Derry and 40.1 per cent in Belfast, where public transport is more common. In general, the population became more educated over the last decade with a fall in the number of people with no qualifications and a doubling in those qualified to Level 4 i.e. including undergraduate degrees.
2001 statistics were collected for 16-74 year olds whereas all persons aged 16 or over were asked about their skills levels in 2011. A total of 416,851 people were unqualified in 2011.
66.2 per cent of the 16-74 year olds were economically active, compared to 62.3 per cent in 2001. 35.6 per cent of people in that age bracket was in full-time employment. Full-time employment was highest in Castlereagh (42.2 per cent) and lowest in Strabane (28.6 per cent). 15.7 per cent of 16-74 year olds had helped with or carried out voluntary work.

