Building city dashboards

The intensified generation of large volumes of data relating to a city’s form and activities has prompted the emergence of city dashboards. Stephanie Keogh, a Data and Training coordinator on Building City Dashboards, based in the National Centre for Geocomputation in Maynooth University, writes.
The smart city and open data initiatives have served to promote the release of these data, traditionally managed by city departments and agencies, into the public domain via government and local authority data portals (e.g. www.data.gov.ie, www.dublinked.ie). The availability of administrative and real-time data has stimulated the emergence of city dashboards internationally. Simply put these city dashboards are a way of communicating how the city is operating using a range of static and real-time interactive data visualisations (e.g. gauges, maps, graphs, video/photos and 3D models) via the internet. Dashboards can be seen as a user-friendly, intuitive means for organising and visualising complex city datasets; administrative data sets can be used to monitor and evaluate a variety of city indicators, such as unemployment, public transport journeys and house prices, allowing for intra/inter-city comparisons to be made; and citizens can quickly access real-time information on the current air quality, weather and traffic and travel conditions.
Dashboards should be regarded as a key component of the smart city; up-to-date intelligence about all aspects of the urban environment aid city- and citizen-level decision making, for example efficiencies can be gained from investigating archived real-time information on traffic and travel conditions. Furthermore, evidence-based policy decisions can be made when insights and knowledge are extracted from long term, complex and interlinked city datasets.
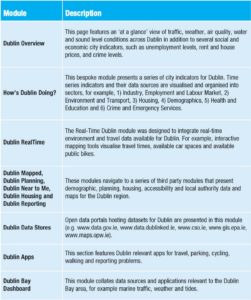
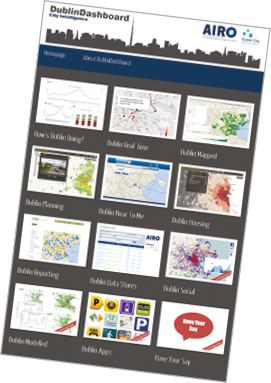
The Dublin Dashboard is once such city dashboard. Developed in 2014 by researchers from the Programmable City project in Maynooth University working in collaboration with Dublin City Council it provides citizens, city officials, public sector workers and companies with real-time information, time-series indicator data, and interactive maps about all aspects of Dublin city. The dashboard pulls together real-time data from Dublin City Council (e.g. Travel-time Reporting Integrated Performance Systems – TRIPS, sound level data, Dublin Bikes), the Environmental Protection Agency, Transport Infrastructure Ireland and the Office of Public Works. Static data sources include the Central Statistics Office, Eurostat, the Department of Housing, Planning, Community and Local Government, the Private Rental Tenancies Board, the Department of Health, the Department of Education and Skills, Fáilte Ireland and the Road Safety Authority. These datasets are organised and visualised across a range of a) bespoke modules developed by the Programmable City team (e.g. Dublin Real-Time) and b) third party tools (e.g. Myplan.ie) that can be accessed from the home page.
There is a total of 11 modules on the Dublin Dashboard.
In 2016, Science Foundation Ireland awarded a team of researchers within the National Centre for Geocomputation €2.4 million in funding to address several challenges around managing complex city data and building city dashboards. The newly established Building city dashboards (BCD) project seeks to determine how to build more extensive and effective city dashboards. It aims to develop new tools that extend beyond data visualisation tools to provide robust data analysis and decision support frameworks that can be used by city experts and citizens alike. In order to achieve this, there are a number of significant fundamental, technical and practical issues that require research attention to enable such smart city outcomes. These issues can be divided into three main sets of problems.
1) Data problems: establishing and ensuring data quality and veracity; creating and implementing new data standards; handling and combining varied datasets (structured, semi-structured and unstructured data); processing and archiving real-time data; and producing new official statistics based on big data.
2) Visualisation and interaction problems: producing effective visualisations and visual analytics; creating optimal visualisations for different devices and platforms; developing augmented reality and alternative data presentations; and improving user experience and social interaction with data.
3) Analytics/modelling problems: moving beyond visual analytics to perform data analytics, statistical modelling, and generate and evaluate predictions, simulations, and optimisations.
The aim of the building city dashboards project is to tackle these three sets of problems in a systematic and rigorous way by significantly extending on-going research that has built the Dublin Dashboard, one of the most comprehensive public city dashboards internationally. The team will use a lighthouse/follower model of development to create a test-bed for developing city dashboards allowing us to test its transferability to and implementation in a second city (e.g. Cork – see www.corkdashboard.ie).
In so doing the project will produce insights, new techniques and tools, and solutions of fundamental relevance to urban dashboard developers, city managers, projects working with urban big data and developing smart cities, and the open data movement, using a holistic and interdisciplinary approach (computer science, geocomputation, spatial statistics, multimedia). To facilitate such work, the project is extending the working partners to include Fingal County Council, Cork City Council, Cork County Council, Cork Smart Gateways, Dublinked (which includes the two other Dublin local authorities), the Central Statistics Office (CSO), and Ordnance Survey Ireland (OSI). The dashboard for Cork (www.corkdashboard.ie) will incorporate and visualise a suite of datasets, static and real-time, relating to the city and county of Cork. Real-time information and alerts relating to river levels for example will serve as a useful tool for local residents and businesses looking for up-to-date information on their area. Additional tools to be developed by the project team will include citizen-focused mobile and web based apps that can be tweaked by the user to match their preferences (e.g. local weather forecasts, journey times, public transport information).

*The principal investigators and developers on the project who have contributed to the text include Chris Brunsdon, Martin Charlton, Stephanie Keogh , Rob Kitchin, Gavin McArdle and Jeneen Naji.


