Northern Ireland’s public finance system
 Tom Healy, Director of the Nevin Economic Research Institute, explains the budgetary framework and considers the general trends for spending on public services.
Fiscal austerity has dominated public discourse across Europe for more than half a decade. The UK and Northern Ireland have been no exception. Recent weeks have seen growing controversy and political tension as public spending cuts imposed by the UK Government continue to impact on the local provision of public services and incomes.
Add to this the threat or the seduction – depending on which way one might interpret it – to offer devolution of corporation tax powers before next May in return for good local political behaviour and adherence to further Westminster-imposed austerity measures. It is suggested that the UK is only a little more than one third of the way through a decade of fiscal adjustment – this in spite of the relatively positive recovery in UK GDP.
Total public spending is around two-thirds of local ‘gross domestic product’ (GDP) in Northern Ireland. In a full year, total income or output, in Northern Ireland, is roughly £30 billion (latest estimate was for 2012 when it was £29.4 billion). Total public spending by government in respect of Northern Ireland is estimated by the Department of Finance and Personnel (DFP) to be approximately £24 billion. The position is summarised by DFP in the Northern Ireland Net Fiscal Balance Report for 2011-2012, released in April of this year, as follows: “Total managed expenditure in Northern Ireland was estimated at £23.8 billion in 2011-2012; of this £19.4 billion was identifiable, £3.3 billion was non-identifiable, and £1.1 billion represented ‘accounting adjustments’.”
Identifiable public expenditure – the more commonly used aggregate – is comprised of three revenue streams (see table below).
As a rough approximation, DEL is ef§quivalent to the Westminster ‘block grant’. AME is largely outside Northern Ireland’s control while the allocation of DEL is under local control with the overall ceiling set by Westminster.
Within the UK revenue statistics (excluding North Sea oil), total revenue collected in Northern Ireland is estimated to be around £14 billion leaving a gap of just under £10 billion in any year. This is equivalent to about one-third of local economy gross value added (GVA); it is not possible to estimate gross domestic product (GDP) precisely for Northern Ireland.
Regional public spending (2011-2012)
| Revenue stream | £ billion |
| Departmental expenditure limits (DEL) | 10.4 |
| Annual managed expenditure (AME) | 8.1 |
| Locally generated funds (mainly rates) | 1.3 |
| Total | 19.8 |
Regional deficit
The government deficit in Northern Ireland is a significant percentage of local ‘GDP’. DFP estimates that the government deficit rose from 22 per cent in 2007-2008 to 33 per cent in 2011-2012, as income contracted and unemployment rose. Using HM Revenue and Customs estimates of revenue, the gap between spending and revenue would be around £10.6 billion in 2011-2012 instead of £9.6 billion (as per DFP estimates).
However, there is an important qualification on this estimate. If non-identifiable spending (e.g. UK defence and debt service costs) is excluded, the net fiscal deficit or transfer for Northern Ireland was only £5.2 billion in 2011. In other words, the ‘government deficit’ for Northern Ireland would be around 18 per cent of local total income instead of 33 per cent.
There is a significant transfer between UK regions with the Celtic fringes and Northern England receiving transfers from the South and South East of England. Such a level of regional within-state transfer is not unusual in international terms. In the grand sum of things, the transfer of £10.5 billion to Northern Ireland, while large, represents only 0.6 per cent of total UK GDP or national income.
Northern Ireland shows the highest spend per capita (chart 3) when it comes to identifiable spending. The block grant of £10.5 billion in 2013-2014 underpins much of the gap along with demand-driven characteristics. A comparison might be made with that of County Donegal or Lancashire. Total estimated public spending per person in County Donegal is likely to be higher than is the case in Dublin due a range of factors including population density and structure of population. There are some parallels in the case of Northern Ireland, as it stands, in relation to the national UK Government – although it has somewhat greater fiscal powers than County Donegal in terms of raising local taxes and deciding on distribution of public spending.
Revenue raising?
The Northern Ireland Executive has very limited discretion to raise additional revenue. The revenue profile of Northern Ireland government finances shows just over £1 billion in local and regional authority taxes (rates and other revenues). Local government receipts plus the regional rate set by the Northern Ireland Executive are made of two components: domestic rates equal to roughly half a billion in a full year and business rates equal to roughly the same amount again. District council rates pay for parks, bin collections and other local services while the regional rate is not tied to specific areas of public spending. All told, Northern Ireland has discretion over about £1 billion in annual revenue equivalent to only 3 per cent of total regional income. Beyond that, it has limited discretion in regards to the allocation of Westminster funds – almost entirely under the heading of DEL which comes to a little over half of total identifiable public service expenditure in Northern Ireland.
In addition to local rates, the other area of potential additional local discretionary funding lies in borrowing under the Reinvestment and Reform Initiative (RRI) first put in place in 2003. This is borrowing, for capital purposes, under the UK National Loans Fund. In recent years, the amount borrowed has varied around the £200 million mark. There is, also, very limited scope for EU investment funding matched by local funding under DEL.
Block grant cuts
Planned public spending cuts in Northern Ireland concern mainly the block grant component. Looking to the future, the Executive is planning for further cuts to spending in 2015-2016 as well as later years. The draft Budget for 2015-2016 has signalled cuts in particular departmental allocations. It is important to note that these cuts – the details and allocation of which are at the discretion of the Executive – impact on the DEL component of public spending. The total proposed cut in “non-ringfenced resource DEL” (or simply the bulk of the block grant for current spending) is just over £200 million or 2.1 per cent in nominal terms (the real cut would be over 3 per cent).
When AME is factored along with DEL, the overall discretionary or planned real cut in Northern Ireland public spending at current levels of service is somewhat less than 3 per cent, depending on the final decisions to be made in relation to AME. However, based on the Public Expenditure Statistical Analyses (PESA) data, public spending measured in real terms is projected to rise slightly between 2013-2014 and 2015-2016. In part, this reflects demographic and other pressures not least in the area of health where, universally, cost pressures are inexorable.
Spending trends
The data indicate growth over time in total nominal spending from £16.8 billion in 2007-2008 to £19.7 billion in 2012-2013, the last year for which final data are available currently. When this upward trend is set against inflation, as measured by the UK GDP price deflator, public spending was up by 5.1 per cent in real terms. Notwithstanding fiscal austerity measures already implemented in Northern Ireland, this upward trend in real public spending reflects the impact of recession in Northern Ireland as a surge in unemployment and a rise in income-related tax credits and other social spending pushed up overall spending.
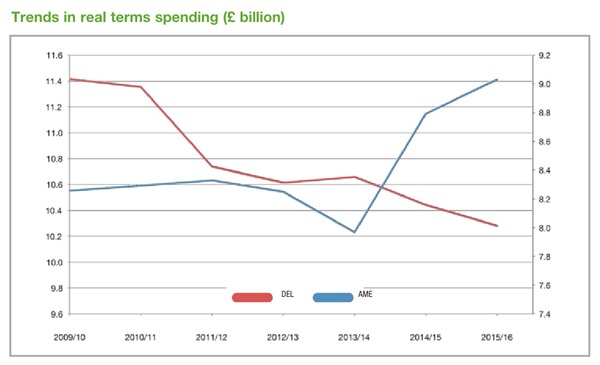
The chart above illustrates a continuous downward trend in real DEL spending. This is what some refer to as the Westminster block grant – the money that goes to pay for day-to-day departmental spending and the allocation of which is under the control of Stormont. Demand-driven spending (AME) recovered after 2012-2013.
It is significant that the UK Government adopted a relatively moderate approach to fiscal austerity until 2010. Combined with an expansionary monetary policy entailing bond purchases by the Bank of England and low interest rates. This helped to mark out the UK and the US as relatively more successful in weathering the storms of recession and effecting a recovery, albeit a fragile and unequal one in the case of the UK.
To date, UK governments have ‘implemented’ or signalled £90 billion in fiscal austerity measures (cuts in spending or increases in revenue). Some of these measures were cancelled out by counter-measures. The extent of fiscal effort to lower borrowing was equivalent to very approximately 5 per cent of GDP at the start of the current recession. By contrast, governments in the Republic of Ireland have extracted approximately 20 per cent of Irish GDP since 2008.
Northern Ireland has benefited from these global and macro-level impacts. However, it has also taken its share of cuts especially in those areas of the UK public service that were most severely cut i.e. non-ringfenced departmental current spending. Northern Ireland took a disproportionate hit of 5 per cent in real terms between 2009-2010 and 2013-2014, while the UK as a whole took a hit of 2 per cent over that same period (combining current and capital DEL and AME into total managed expenditure in real terms).
Projections of public spending to the year 2016-2017 signal significant cuts in real public spending in the UK and in Northern Ireland. Current DEL spending – the current part of the block grant – expects a cut of 3 per cent in real terms between 2013-2014 and 2015-2016 in Northern Ireland.
This may be taken in conjunction with rising population: up from 1.7 million in 2001 to an estimated 1.85 million in 2014 and set to rise to 1.9 million. The impact of age-related demographic pressure is particularly evident in health where, according to the Institute of Fiscal Studies a real freeze in NHS spending between 2010-2011 and 2018-2019 would be equivalent to a 9 per cent cut in real age-adjusted NHS spending per person.
We can be sure that as the 21st century progresses, fiscal sharing will become an increasingly contested area within the UK as its constituent components argue out the best way of organising its flows, and as fiscal powers are devolved. This happens in the wider geopolitical context of the European Union with its evolving toolbox of fiscal rules.
The Net Fiscal Balance Report is published at www.dfpni.gov.uk and PESA data are available at www.gov.uk/hm-treasury


